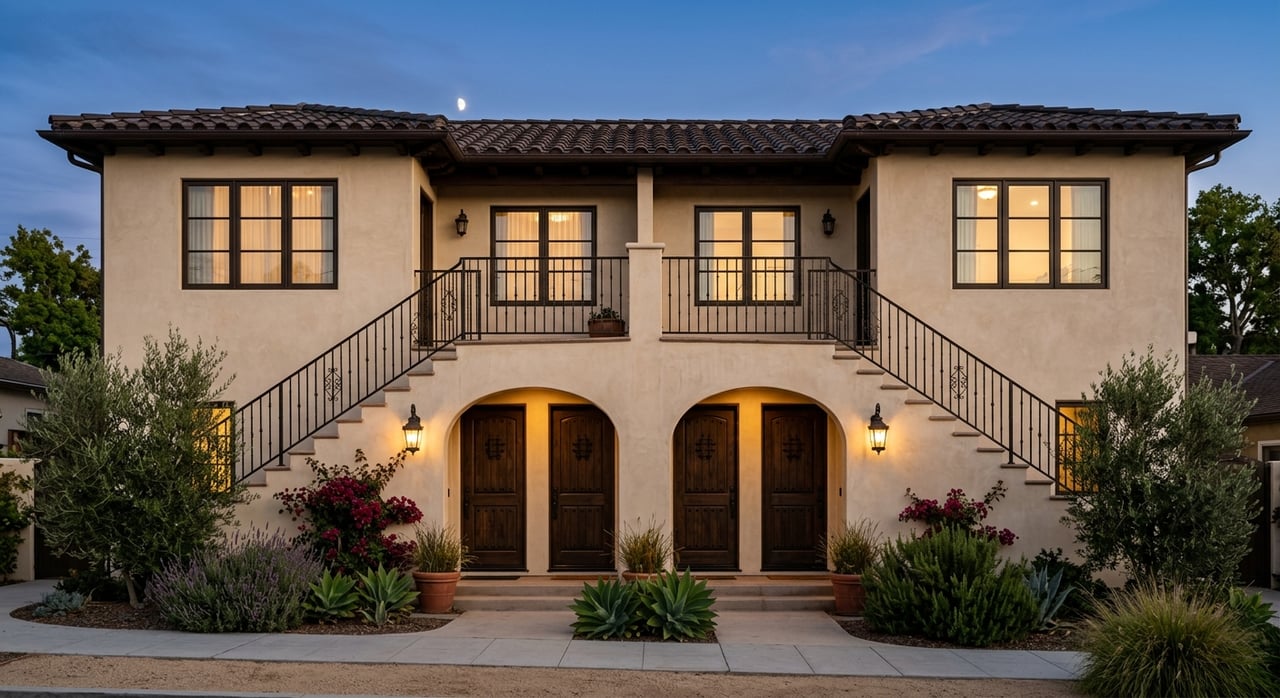
Looking at a duplex, triplex, or fourplex in Solano County can feel exciting until the numbers start getting fuzzy. Rents vary by city, comp sets can be thin, and one bad assumption can change the whole deal. If you want a clearer way to evaluate multi-unit property in Solano, this guide will show you how to build a practical underwriting framework using public market data. Let’s dive in.
Why Solano County Draws Investors
Solano County offers a different entry point than many inner East Bay markets. According to Census QuickFacts for Solano County, the owner-occupied housing rate is 63.0%, and median gross rent was $2,163 for 2020-2024. The same report helps explain why investors often compare Solano to higher-cost Bay Area markets when looking for income potential.
Small multifamily also matters here, even if it is not the dominant housing type. Solano County’s housing element appendix shows the housing stock is 76.1% single-family, 21% multifamily, and 2.9% mobile homes, with 6.3% in two-to-four-unit buildings and 11.7% in five-plus-unit buildings according to the 2023-2031 Solano County Housing Element appendices. That matters because fewer small multifamily properties can mean fewer direct comps, especially for duplexes and fourplexes.
Start With Rent Comp Discipline
One of the biggest mistakes investors make is mixing rent sources without thinking about what each one measures. MTC Vital Signs tracks asking rents for available units and notes that local data mainly reflects larger rental properties, while Zillow trend pages are also listing-based. Census median gross rent reflects occupied units, so it works better as a cross-check than as a direct comp source.
The key is to use one method consistently in your analysis. If you start with asking-rent comps, stay with asking-rent comps through your rent estimate. That gives you a cleaner underwriting model and helps you avoid overstating value.
Use Same-City Rents First
For Solano County, public asking-rent benchmarks are a useful starting point. MTC Vital Signs says Solano County’s typical asking rent was $2,422 in 2025. Zillow’s February 2026 figures in the research report show county average rent at $2,383, with city benchmarks at $2,476 in Fairfield, $2,500 in Vacaville, $2,395 in Benicia, $2,000 in Vallejo, and about $2,400 in Rio Vista ZIP 94571.
That does not mean every unit in those cities should underwrite at those exact numbers. It means your first step should be same-city comps, then nearby Solano cities with similar property age and tenant profile, and only then a countywide average if direct comps are limited. This is especially important in a market where duplex and fourplex comp sets may be thin.
Keep 94571 in Context
If you are analyzing a property in 94571, Rio Vista’s reported average rent of about $2,400 is a local benchmark, not a universal rule. A renovated unit, a dated unit, and a unit with a different bedroom count may all perform differently. The local number gives you a starting point, but the property’s actual condition and mix still drive the final rent conclusion.
Compare Solano to the East Bay Carefully
Solano often shows up as a value-and-income comparison market when you line it up against the inner East Bay. MTC Vital Signs reports a Bay Area typical asking rent of $3,071 in 2025, while the research report cites East Bay asking rent at $2,569 and Berkeley at $2,718. That spread is one reason investors look north and east for lower-basis opportunities.
Still, you do not want to analyze a Solano duplex using single-family appreciation logic or broad Bay Area averages alone. Multi-unit investing works best when you focus on income, expenses, and realistic stabilization. Solano may offer a lower-rent profile than Berkeley or parts of the inner East Bay, but that does not automatically make every deal a bargain.
Underwrite Vacancy With a Base Case
Vacancy assumptions deserve more attention than they usually get. Solano County’s housing vacancy rate was 4.6% in 2023, based on the CEQA housing data cited in the research report. City-level rates ranged from 3.5% in Benicia to 5.2% in Suisun City, with Vallejo at 4.5%, Fairfield at 5.0%, and Vacaville at 4.0%.
That range gives you a reasonable baseline for stabilized underwriting. If the property has deferred maintenance, weak unit appeal, or a more volatile location within its local market, you may want to underwrite a little more conservatively. If the building is well-maintained with strong leasing appeal, a county-level baseline may be more appropriate.
Avoid One-Size-Fits-All Assumptions
This is where local nuance matters. The research report notes that East Bay vacancy was 5.5% in Q1 2025, while Berkeley reached 8.0% in Q4 2025. Solano’s lower countywide vacancy is useful, but it does not mean every submarket performs the same way all the time.
In other words, use vacancy as a market-informed estimate, not a shortcut. A realistic vacancy assumption can protect you from overpaying more than almost any optimistic rent-growth number can.
Build Expenses From Public Data
Many investors focus on rents and cap rate first, but expenses can quietly reshape a deal. In Solano County, one of the easiest line items to anchor is property tax. The California State Board of Equalization property tax report shows Solano County’s average property tax rate was 1.169% in 2023-24.
The county assessor framework matters too. The research report notes that actual tax bills include the 1% base rate plus voter-approved bonds, service fees, and special assessments. That means your quick tax estimate should not stop at the base rate alone.
Use Taxes as a Reality Check
Before you trust a broker pro forma, pressure test the tax line. A rough estimate at about 1.17% plus parcel-level assessments is often a better starting point than a stale historical tax number, especially if the property may reassess after sale. This is one of the simplest ways to make your underwriting more realistic from day one.
Factor in California Rent Cap Rules
If the property is older, rent-growth assumptions should stay grounded. The California Attorney General’s tenant and landlord guidance states that most properties older than 15 years are covered by the statewide rent cap. Annual increases are generally limited to 5% plus inflation or 10%, whichever is lower.
For many duplexes, fourplexes, and older small apartment buildings, that means aggressive future-rent projections can be risky unless the asset is clearly exempt or there is a documented value-add plan. If your deal only works with steep rent jumps, it may not be as strong as it looks.
Use Cap Rates as a Benchmark
Cap rate is not the first number to build, but it is an important number to test at the end. The research report cites Cushman & Wakefield’s Bay Area investment report showing Bay Area multifamily cap rates at 5.4% in 1H 2025. It also references East Bay at 4.9%, Berkeley at 5.3%, and a Bay Area figure of 6.0% from another Q4 2025 report.
Solano-specific public cap-rate surveys are harder to find, so the smarter move is to benchmark against nearby Bay Area multifamily data instead of relying on appreciation narratives. Once you estimate stabilized NOI, test whether the implied cap rate makes sense relative to those regional benchmarks. If the return looks too thin for the property’s condition or location, that is worth a closer look.
A Simple Solano Deal Analysis Sequence
If you want a practical framework, use this order:
- Start with same-city asking-rent comps.
- Broaden to nearby Solano cities only if direct comps are limited.
- Use countywide rent figures as a fallback, not your first choice.
- Apply a vacancy assumption around the 4.6% county baseline, then adjust for condition and submarket.
- Estimate property taxes at about 1.17% plus parcel-specific assessments.
- Verify whether statewide rent cap rules may affect future increases.
- Calculate stabilized NOI.
- Compare the deal’s implied cap rate to recent East Bay and Bay Area multifamily benchmarks.
That sequence helps keep your analysis grounded in public data instead of guesswork. It also gives you a repeatable process you can use from Vallejo to Vacaville to Rio Vista.
What This Means for Your Next Deal
In Solano County, multi-unit analysis is less about chasing a headline and more about building a disciplined model. Rent comps can be thin, city differences matter, and details like vacancy, taxes, and rent caps can change your return faster than you expect. If you stay consistent with your rent methodology and benchmark the deal against real multifamily metrics, you will be in a better position to spot both risk and opportunity.
If you are weighing a duplex, triplex, or fourplex in Solano County and want a second set of eyes on the numbers, Felicia Duncan offers hands-on guidance for investors who want clear, local context and a practical path forward.
FAQs
What rent should you use when analyzing a Solano County multi-unit deal?
- Start with same-city asking-rent comps, then widen to similar nearby Solano cities if needed. Countywide averages like Solano’s roughly $2,383 to $2,422 asking-rent range are better as a fallback than a primary comp.
What vacancy rate makes sense for a Solano County investment property?
- A reasonable base case is the county’s 4.6% 2023 housing vacancy rate, then adjust up or down based on property condition, unit mix, and submarket.
What property tax rate should you budget for a Solano County rental property?
- Solano County’s average property tax rate was 1.169% in 2023-24, but actual bills can also include voter-approved bonds, service fees, and parcel-specific assessments.
How does California rent cap law affect older Solano County duplexes and fourplexes?
- For most properties older than 15 years, statewide rent cap rules may limit annual increases to 5% plus inflation or 10%, whichever is lower, so conservative rent-growth assumptions are important.
How should you benchmark cap rates for a Solano County multi-unit property?
- Because Solano-specific public cap-rate surveys are limited, compare the property’s stabilized NOI and implied cap rate to recent East Bay, Berkeley, and broader Bay Area multifamily benchmarks in the mid-5% range.